Generating Reports
Single Simulation
Under Reports, both the Summary and the Individual Unit reports provide the same information, which can be seen through View Results.
An Individual Unit report can be created, but it is a very large file displaying the history for each plant community in the landscape for the simulation. When Summary is selected, the following screen is displayed with options for the report.
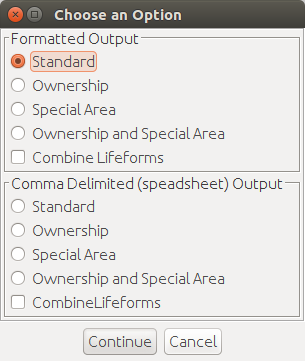
There are two basic options for report output:
- Formatted Output: an easy to read format that looks similar to what is seen in View Results
- Comma Delimited Output: easy to import into a spreadsheet program such as Microsoft Excel
Within both options, other choices are available if these attributes have been assigned to the plant community polygons. Standard provides for no additional breakdown of the information. Other choices will result in the information being stratified by ownership, special area, or both. Reports cannot be made by ownership or special area unless the simulation has been made specifying in the simulation parameters that these be tracked. When Continue is selected, a dialog window opens to the working directory, and a file name fo rthe report can be selected. When providing a name for the reports, use a text (*.txt) extension to make it possible to read the report with a variety of applications.
The Fire Event Summary breaks down the number of fire events by acres and fire size class by time step. The choice of polygon size used in the landscape file can have an impact on what is seen in this report. If the user has created coverage of uniform, ten acre polygons, it would be impossible for any fire events to show up in the 0.26-9 acre class. There would still be fire events in the 0.0-0.25 acre class due to fire suppression or weather events occurring at the time of the ignition event.
All States Report
Reports > All States Report provides the acres for any specified combination of vegetation attributes. If desired for a single simulation, this report is available after the simulation. One does not have to check in the Simulation Parameters dialog that they are wanted. For a single simulation the results after processing through the appropriate Excel spreadsheet will give only total acres. There is no range of occurrences from a single simulation.
Tracking Species Report
Reports > Tracking Species Report is designed to give the acres for the species being tracked.
If desired for a simulation, this report is available after the simulation. One does not have to check in the Simulation Parameters screen that they are wanted. For a single simulation the results after processing through the appropriate Excel spreadsheet will give only total acres. There is no range of occurrences from a single simulation.
Detailed Fire Report
Reports > Detailed Fire Report provides more information on the fire events. It identifies the plant community each event originates in, the communities it spreads to, and what type of fire it is. An asterisk beside a unit number means the fire spread under extreme, wind driven events by spotting to this unit.
The Menu option in the Detailed Fire Report will be unavailable if the Discard Data option is selected.
The Fire Suppression Cost Report is only available if the simulation is made with fire suppression and if costs are included in the fire occurrence and cost input table. This simplified version of fire suppression costs utilizes a per-acre cost based on the size class of the fire event.
At the time the report is selected, the user can change the default discount rate from 1.04 percent. The suppression costs utilize the per-acre cost that can vary by fire size class and fire management zone if that level of detail has been provided by the user. The costs are calculated by using the combination of process origin and the units to which the process spreads to get the size-class of each fire event. The costs are discounted to the middle of each decade time step.
The emissions report was developed for use in a Joint Fire Sciences Study; A Risk-Based Comparison of Potential Fuel Treatment Tradeoff Models and Comparing Potential Fuel Treatment Tradeoff Models. Data is taken from A Database for Spatial Assessments of Fire Characteristics, Fuel Profiles, and PM10 Emissions. The emissions values were developed for Westside Region One, Southern California, Sierra Nevada, South Central Alaska, Gila, and South West Utah zones. These values have not been kept current. Use of the report in any other zone will default to values for the Westside Region One. No user interface access to this system knowledge is available.
Emissions are provided for both fire events and treatments of ecosystem management underburn and broadcast burn. This makes it possible to compare tradeoffs in emissions between simulations with and without treatments. No emissions are calculated for the fuel treatment associated with other activities such as broadcast burning of harvest units, or burning hand or machine piles (what is often referred to as activity fuels).
Multiple Simulations Report
When making multiple simulations, one report file is created automatically. This is a text (*-ls.txt) file with a user-provided name. This report file provides the results from each time step for each simulation for processes, vegetation attributes, fire information, suppression costs, and emissions in a form that can be readily imported into a spreadsheet for further analysis. The use of the Excel spreadsheet with the ls.txt file is the basic processing tool for OpenSIMPPLLE simulations.
With multiple simulations, the same reports can be made at the end of a simulation as with a single simulation. However, if they are made, they are for the last simulation of the multiple set. For example, if you made 10 five-decade simulations, the reports made from the user interface will be for the 10th simulation. The additional report that shows up after a set of multiple simulations is Reports > Multiple Simulation. If ownership and special area are identified within the plant communities, then the report can be stratified By Special Area or By Ownership. Without them, only Normal is available.
The Multiple Simulation Report provides the mean and range of values identical to what is seen throughout the user interface. This report looks similar to what is seen in view results with multiple simulations.